19 Jun 2015

Nmap

In this post we’ll get familiarized with Nmap, network mapping tool. It helps to perform a port scan of hosts in a network and to identify the services provided by them. In short, it is a security scanner.
The software provides a number of features for probing computer networks, including host discovery and service and operating system detection. These features are extensible by scripts that provide more advanced service detection, vulnerability detection, and other features. Nmap is also capable of adapting to network conditions including latency and congestion during a scan. Nmap is an opensource tool primarily made for linux systems, released under the GPLv2 license, and is under development and refinement by its user community.
There are a wide array of uses for Nmap. Afew of them are:
  • Auditing the security of a device or firewall by identifying the network connections which can be made to, or through it.
  • Identifying open ports on a target host in preparation for auditing.
  • Network inventory, network mapping, maintenance and asset management.
  • Auditing the security of a network by identifying new servers.
  • Generating traffic to hosts on a network.
  • Find and exploit vulnerabilities in a network.

  • Getting Nmap
    In linux distributions, Nmap can be installed from the terminal.  In Ubuntu, you may install using sudo apt get-install nmap
    I have seen GUI version of the tool in Ubuntu Software Center, but I prefer the terminal version. Give it a try if you like.
  • Run
    Nmap
    An example run of Nmap
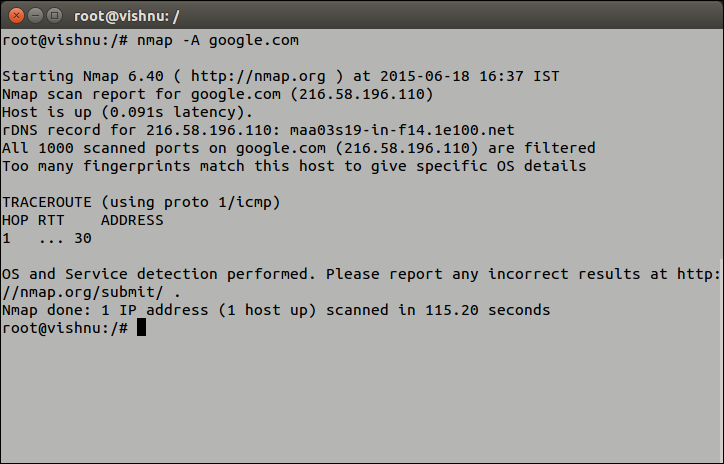
    Nmap is run as a command from the terminal with appropriate switches to obtain the desired outcome. You may refer nmap man pages for the complete list of available switches. As an example, here are a few commands:
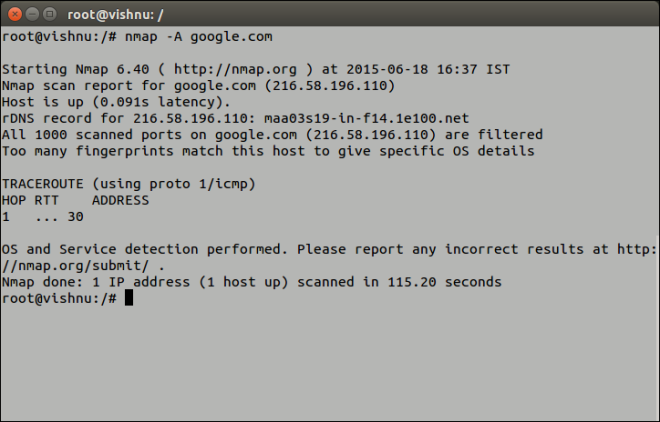
  • Save and View Scan Report
    Scan report can be redirected to a text file for later use. This is done using the –oN switch. The command is nmap -p --oN

Wireshark

Wireshark is an open source, free network packet analyzer. It captures packets in real time and lists them in a user friendly GUI with options to color code, filter and much more. It is a defacto GUI tool to monitor network traffic and can be considered astcpdump with GUI front end and integrated sorting and filtering options. If you find it interesting to read on its history, the wikipedia page should be helpful.
We’ll just look into a few of it’s aspects and capabilities now.

  • Getting Wireshark
    As mentioned earlier, it’s a free open source tool. So you can freely download and install on your system from its official download page and is available for windows, Mac OS X and Linux distributions. On Ubuntu, you can install it from the command line:
    sudo apt-get install wireshark
  • Run

    Run Wireshark with root provileges. This is important!
    gksudo wireshark
  • Wireshark Window
    Wireshark Window
    Wireshark Window
    Upon starting wireshark as su, the main window displays the interface list. The interface list displays the available network interfaces in the system, with options to start the capture. Capture options dialog will help you to specify various options to follow during packet capture.
    Capture Options
    Capture Options Window
  • Capture Window
    Wireshark Capture Window
    Capture Window
    The Capture Window as shown above displays the captured packets in real time. You can inspect each packet’s content, by choosing the appropriate packet from the packet list, in the packet details and packet bytes sections. Packets can be color coded for each protocol, filtered according to various filtering parameters and sorted on various fields.
  • Start Packet Capture

    To start packet capture for a desired interface, you can select that interface and simply click on the start button. The Capture Window will appear showing real time captured list of packets.
  • Apply Filter

    You can use the filtering option to filter and display captured packets according to some criteria. Appropriate filtering options can be specified into the filter box in the filter tool bar. An example criteria can be to display packets send from a particular ip(say 10.20.30.40). The suitable filtering option here will be
    ip.src == 10.20.30.40
  • Save and Load Capture Data

    The captured packets can be saved as a capture file on to the disk for later use. Save the capture with a desired file name as a .pcapng file. Wireshark also allows to save the capture file in other packet capture file formats like pcap, libpcap, Microsoft NetMon formats.
  • Crack passwords

    Thus, with Wireshark you can inspect the network packets. This obviously means you can open it up in the packet byte section and read them. What more do you need to read a submitted form fields? Or more specifically passwords? Try creating a localhost website with a password field and capture the packets transferred during form submit. You can easily find the submitted form fields in one of the captured packets. 
    Now that you have succeeded to steal passwords why don’t you try it out for somebody’s facebook or gmail password? To start with, steal your own facebook password. Capture the packets and inspect them. What do you see? Yeah, that’s all about https.